Sunday, December 4, 2016

Lab 21: Physical Pendulum; Lab Partner: Jamie Lopez; Lab date: 11/27/16

2) In this lab, we will determine the period of the pendulum in different shape objects.

3) When an object oscillates, the period is dependent on the moment of inertia and the center of mass. We will prove with different objects that each period will come with a resultant differently. I will present first a theoretical approach for each object and later show the results of our experimental.
The objects we will be using in this lab will be a circular ring, and semicircle, and a isosceles triangle. I will present each each picture in order of the objects.

 For this circular ring, I have to find the average moment of inertia between the outer and inner ring.

For the semicircle, we chose two points of the circle  for the object to oscillate. The hemisphere of the circle and the top curvature of the circle. On the hemisphere, we know the moment of the inertia of the disk is still half times the mass and radius. To find the top curvature part of the circle of the moment of inertia, we applied the parallel axis theorem.


Lastly we did the isosceles triangle upright and upside down. The point of the triangle standing upright will be the apex and the middle of the base of the triangle will be called the base. We chose those two points to find the oscillation period of the object. These two illustrations indicate the points of the moment of inertia. we found the moment of inertia at the apex, center of mass, and the base.

These are the results of the period for the object.

4) What we did for the experiment was to use logger pro oscillating sensor and detect the period of the objects. Here are the results of each object in the same order I presented in the theoretical results.

Object of the ring


Object of half circle rotated at the flat side


Object of the half circle rotated at the curvature side


Object of the triangle at the base


Object of the triangle at the apex.

Here is the summary results of the experimental results


5) Our experiment and theoretical results came close to what we predicted. Our margin error was on average 5% but it's really close. Applying the tape and paperclip for the object to oscillate was maybe was caused the error in our calculations or our measurements as well.

Tuesday, November 29, 2016

Lab 20: Conservation of Linear and Angular Momentum; Partner: whole class; Lab: 11/21/16

2) In this lab, we will determine the conservation of linear and angular momentum and compare the differences of angular momentum at the radius at which the ball is caught.

3) Before understanding angular momentum, we should introduce the mechanics of it. It is similar to linear momentum; however, we will be looking at the object when it is influenced under rotational motion instead of linear motion. Since linear momentum requires some mass and velocity, so does the angular momentum. Instead of linear velocity, we will translate it to angular velocity and the point the radius when the force is exerted. So with values of the mass, radius and angular velocity, these values equal to the moment of inertia and the angular velocity. Angular momentum is still applied to the same ruled for conservation of energy. Since our lab will be experimenting inelastic collision, energy will not be conserved at some point.

4)
To understand how our apparatus works, the ball will be positioned at some height D of the inclined ramp and will slide down. Once it slides down, the ball will slide to the ball catcher and at that point, the apparatus will be influenced of angular momentum. So we know the angular momentum is the conclusion of the inelastic collision. The initial momentum will be the ball traveling under linear motion when it leaves the ramp. The ball catcher lands on the 8.1 centimeter mark from the rotating axis, and the 4.1 centimeter mark from the rotating axis. So we will be looking at two cases and compare the results of our experiment.

5) With the data we measure of the dimensions and the mass of our apparatus, here are our illustration and our theoretical results of what we expect from our experiments. Since we know our initial inelastic momentum is the mass of the ball and the velocity, we have to solve for velocity. We placed a carbon paper on the floor and did 5 trials to measure how far the ball lands on the ground. With the dimensions we measured for height "H", we used kinematics to solve for the velocity going in the horizontal direction. We came up with 1.33 meters per second.

 Once we come up with our linear velocity, our next value to solve is the moment of inertia of our apparatus. We did the same procedure similar to lab 16 to find the average angular acceleration and plug the results into the equation for moment of inertia. The radius of the apparatus will be the torque pulley and the hanging mass to be included in our equation. 
Now we are ready to solve for our theoretical conclusion for angular momentum. Our assumption for our experiment will be the initial momentum equal to final momentum. Our initial will be linear momentum and our final will be angular momentum. By the illustration provided, our results for angular velocity for two different cases is demonstrated to our prediction.

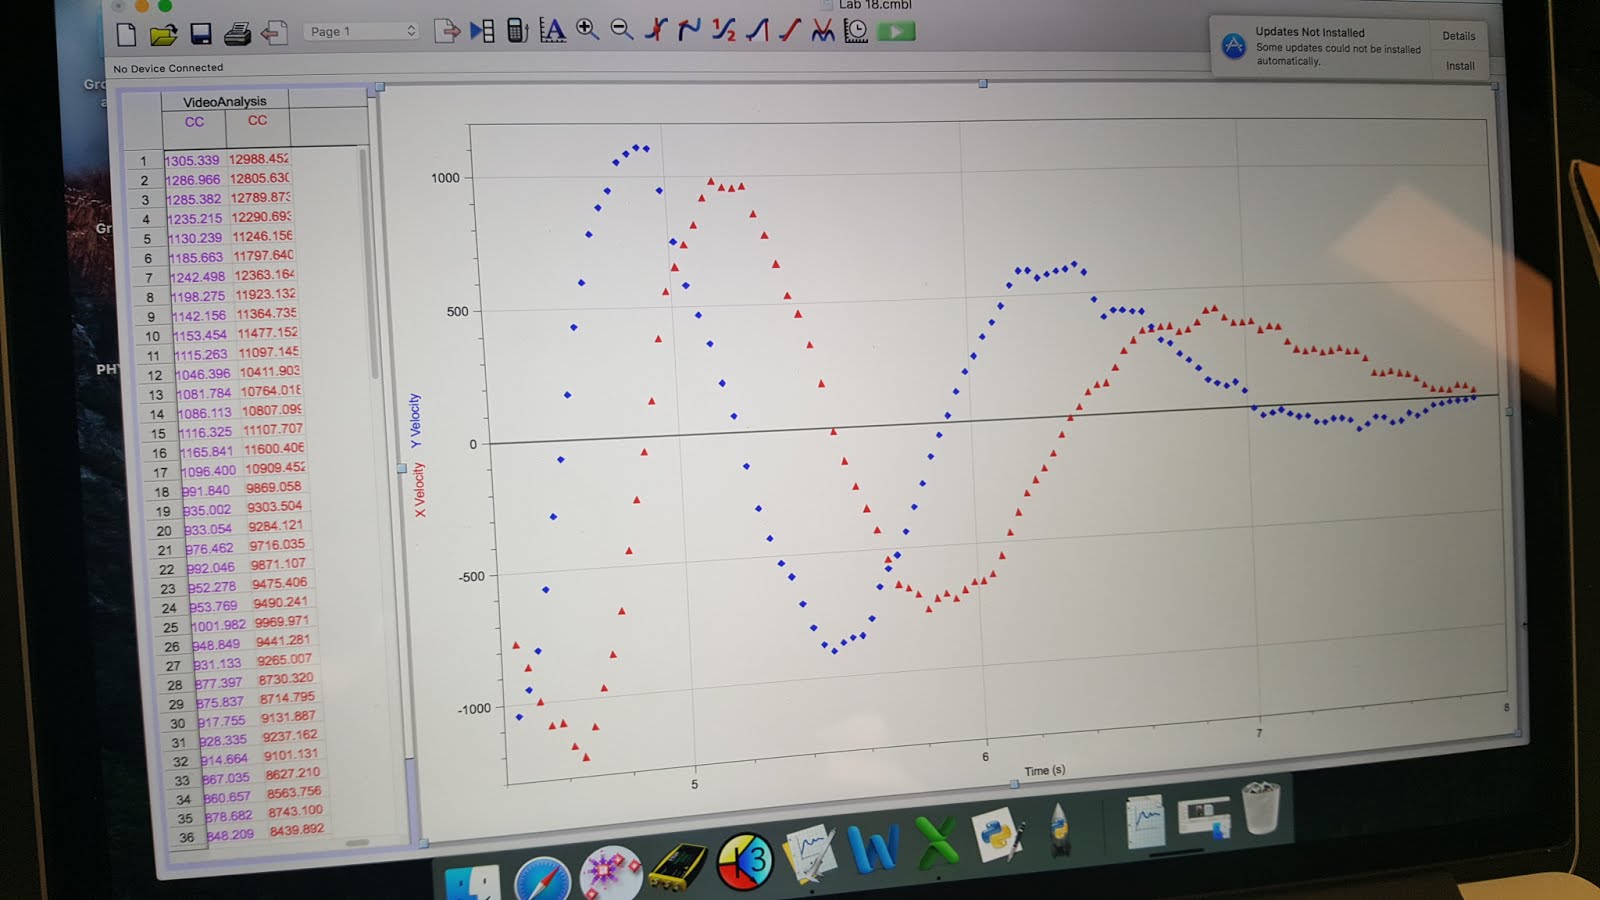
6) Now it's time to do the experiment and use logger pro to find if our prediction is correct. 
This graph represents the linear velocity graph when the ball lands on the ball catcher at the 8.1 centimeter mark. 
Later we derived our linear velocity and transform it to the angular velocity by using the equation linear velocity divided 8.1 centimeters. For the 4.1 centimeter mark, the graph would look exactly the same.
7) So our theoretical conclusion came close to our experimental. But the intuition of our results makes sense. If the ball hits at the point of the radius farther than the other point of the radius that is closer to the origin, the angular velocity will rotate faster. It is the same application when pushing the door open with the same force on two different points from the origin.

8) Now an additional question is asked, is energy conserved. In our experiment, at some points the energy of the ball was conserved and lost. In the beginning when the ball slid down the ramp before colliding the ball catcher, energy is conserved. It is only gravitational potential energy and kinetic energy the ball is experiencing. Of course, there is some friction when the ball slides down the ramp, but energy lost to that value is barely negligible. After the ball slides off the ramp and lands on the ball catcher, some energy is stored with the colliding mass and the angular speed decreases. So energy was lost of the concluding angular momentum. 
Now gravitational potential energy and kinetic energy should be equal to each other. Some margin of error was lost. What I did to make the energy conserved was I made the linear velocity and unknown value and derived it. The linear velocity should've been around 2.3 meters per second instead of 1.33 meters per second. Since our theoretical was slightly off to our experimental, it is assumed our energy theory would be slightly off as well. But as kinetic energy from linear to rotational decreases, it is intuitive why the energy was lost.

Friday, November 25, 2016

Lab 19: Conservation of Energy/ angular momentum; Lab Partner: Jamie Lopez; Lab: 11-21-16

2) In this lab, we will approach to prove that energy and angular momentum is conserved when an object is undergoing angular motion and find the height the meter stick elevates before rest.

3) Just as translational and rotational motion relate in kinematics, they also relate in conservation of energy and angular momentum. We will prove our theory in conservation of energy and angular momentum is true and compare the results to our experiment. In this experiment, we will only show two types of energy that the object will be influenced to: gravitational potential energy and kinetic energy. Here is a step by step illustration to show that energy and momentum is conserved. 
Once the meter sticks collides inelastically with the mass of the class, both object are now undergoing kinetic energy to potential energy until both masses reach its' highest point. To solve for the angle which the masses reach its's highest point, we derive for theta using the energy theorem. The height will be the product of the center of mass and one minus cosine theta. These are what our results came to be.

4)
Here is a picture of our apparatus to prove our theory is correct. The second picture is a video of our apparatus and clicking in the points per frame. Those points will be used as displacements while the object goes into angular motion.

5)
This is the only data we had to measure for our theoretical and experimental results. The first picture is just the masses and the distance of the pivot point we measured to plug into our equation. The second picture are the data points of the y-axis vs time. We placed the center point of axis where the meter stick is perpendicular to the ground but not touching. We measured that at zero meters. The picture in 4.2 is a better visual for better understanding.

6)

7)With the data points according to logger pro, this is a graph of the displacement of the both objects going in rotational motion. It is almost similar to a sine function. But of course, after the zero meter point, the slope decreases meaning the meter stick collided with the mass of the clay so the angular velocity decreased.

8) The results we got in our theoretical calculation is really close to our experiment. Both heights of the lab results range at one tenth meter above ground. This result still proves that conservation of energy and angular moment around object can be conserved.

Tuesday, November 22, 2016

Lab 18: Moment of Inertia and Frictional Torque; Lab Partner: Dahlia Nguyen; Date: 11/14/16

2) In this lab, we will determine the time for the cart as it travels down a ramp one meter. The cart will experience tension from the metal disk as the metal disk rotates.

3) There are many components happening in this lab. In order to find the time the cart travels one meter, our theory is to relate the tangential acceleration of the metal disk is equal to the acceleration of the cart. Let's first look at the metal disk. As the metal disk is rotating from the pull of the cart, the metal disk is experiencing two different types of torques. The first torque is the tension force from the cart. The second torque the metal disk will be experiencing is frictional torque. We will sum these torques to equal the moment of inertia of the disk and the angular acceleration. Instead of the string applying torque on the outer rim of the disk, it will be applying torque in the inner radius of the disk. Since the angular acceleration is the same all around the disk, linear acceleration will vary in different points of the radius. We will convert the angular acceleration to the tangential acceleration on the point of the inner radius and find the time it takes for the cart to travel one meter using linear kinematics for the cart. Here is an illustration to find the angular acceleration.

4) We first have to find a way to measure the frictional torque before we calculate the angular acceleration. In this lab, we did a video capture of the metal disk spinning until it stops.
 While the disk is spinning until it stops, the only torque applying to the disk is frictional torque. There's a piece of masking tape applied on the outer rim of the disk. We recorded the rotational motion in slow speed from a video recording phone. Then we uploaded the video on Logger Pro and applied the point on the masking tape each frame until the rotational motion is at rest. The graph it gives us will determine the slope of the angular velocity. That slope is the angular acceleration of friction. We will use this value for our theoretical calculation to solve for time.

On the experimental lab, we use a timer to calculate the time it takes for the cart to travel one meter.  This is an illustration for our experimental lab. We will use three trials for the total time and see if it is correct to our theoretical results.

5) Next we will measure the dimensions of our apparatus to input it in our theoretical calculations.  The apparatus already provides its' total weight. We use the volume formula to calculate the density of the apparatus.
Once we find the density of the apparatus, we calculate the mass of the metal disk in the middle. The illustrations already provide step by step procedures on how to calculate it.

6) When we used Logger Pro, the data provided us a graph for the frictional angular acceleration.


7) The graph first gives us the tangential velocity of the apparatus. So we use the formula to convert the tangential velocity to angular velocity and the radius of the metal disk. Then the results gives us a graph of the angular velocity and we use the slope as the results for angular acceleration for friction.

8) Now with these results giving us the values we need, we are ready to prove if our theoretical calculations match our experimental results. We chose forty degrees will be an appropriate value for the cart's motion. Let's begin on our theoretical calculations. Since the tension from the metal disk is the same tension pulling from the cart, we assume these two objects are being influenced by acceleration. We will focus on the metal disk first. The sum of torques the the metal disk is experiencing is the torque of the tension and the frictional torque. We then derived the tension of the metal disk.
Then we derived the tension from the cart. According the free body diagram, the acceleration the cart is experiencing is the tension from the string and some portion of force of gravity.
Now we let these tensions equations equal each other and derived the angular acceleration. Since the cart was experiencing tangential acceleration, we converted the tangential to angular acceleration and the radius. Now that we found the results for angular acceleration, we convert it back to tangential acceleration and solved for time using kinematics. Our results for time gave us roughly eleven seconds.

Now to prove our experiment will be similar to our theory, we inclined the ramp to forty degrees and made sure the tension is parallel to the cart. After giving three trials using a timer, here are our results.
 The average time gave us exactly the same results for our theoretical calculations!

Monday, November 21, 2016

Lab 17: Finding the moment of inertia of triangle; Lab Partner: Nyugen; 11/14/16

2) In this lab, we will discover the moment of inertia of a right triangle theoretically by using calculus and experimentally.

3) The moment of inertia is a quantity of measurement that express a body's tendency to resist in angular motion. In order to find the moment of inertia, we have to find where the axis is being rotated. If the axis of rotation is located at the edge of a rigid body, the moment of inertia will be a different quantity comparing the axis of rotation being on the center of mass. In this lab, we will find the moment of inertia where the axis of rotation will be at the center of mass. In order to find the center of mass of a right triangle, we use the approach of the density formula using calculus. Here is a step by step illustration of finding the center of mass of a right triangle in the x and y-coordinates.


Now that we found the center of mass of the right triangle, our next approach is finding the moment of inertia at the center. In order to find the moment of inertia, we use calculus of integration of the derivative of the moment of inertia which is the integral of dm multiplied by x squared. But since the integration between the points of the center of mass will get ugly to determine our answer, there's a simpler way to calculate the moment of inertia around a vertical end of the triangle. We can use the parallel axis theorem. The parallel axis theorem is the center of mass plus the moment of inertia of the entire object treated as a point mass at the center of mass. Here is a demonstration to prove the parallel axis theorem.

The center of mass in the horizontal axis is at 1/3 of the base, our variable "h" will be 1/3 because we moved our axis of rotation at the edge of the triangle to find the moment of inertia at the center of mass. Here is a step by step process on finding the moment of inertia at the center of mass.

Now that we found our quantity for the moment of inertia at the center of mass of axis of rotation, we will begin our measurement of our apparatus and compare our theoretical and experimental results are the same.

4) We use the same apparatus for the Rotational Acceleration lab. We do the same method to find the angular acceleration  to find the moment of inertia doing the experimental method.


5) Here is a list of of the angular acceleration we tested in logger pro.


6) Here is a graph of our angular acceleration when the hanging mass accelerated our device in rotation.


7) The graph represents the angular acceleration when the hanging mass oscillates vertically since the force of gravity is the only force in the torque system. The angular acceleration when the hanging mass goes down does not equal when the hanging mass goes up. Also be aware that even though our experiment is "friction-less", there's still frictional torque in the system. the disk isn't truly frictoinless and there is some mass in the friction less pulley.

8) Here is a comparison of our theoretical and experimental results. Before we could show our theoretical results, we needed to measure the dimensions of our apparatus. Now that we measured the dimensions of the rigid bodies for moment of inertia, this is our theoretical results for the moment of inertia of a right triangle.


Before we find the moment of inertia of the right triangle in our experiment, our assumption is that the disk that is holding the right triangle during rotational motion is affected. Our assumption of the moment of inertia is the disk plus the triangle object. Therefore, the moment of inertia of the disk plus the triangle is equal to the moment of inertia of the disk plus the moment of inertia of the triangle. So in this free body diagram, the equation we derived is the sum of the moment of inertia of the disk in experiment one and moment of inertia of the disk plus the triangle in experiment two. 
Using the average angular acceleration between the angular acceleration going up and down, here is how we found the moment of inertia of the triangle base side and height side.


What is peculiar is that the moment of inertia of the triangle base side is 25% error comparing the theoretical and experimental results, and the moment of inertia of the triangle height side is 3% error comparing the theoretical and experimental results. There could've been a frictional torque disturbance during the logger pro reading or a human error. But looking at the comparison of the moment of inertia of the height side is really close to each other; therefore, our theory proves the moment of inertia does affect the angular acceleration when the object goes in rotational motion.
Here is an extra activity of finding the frictional torque in the experiment.